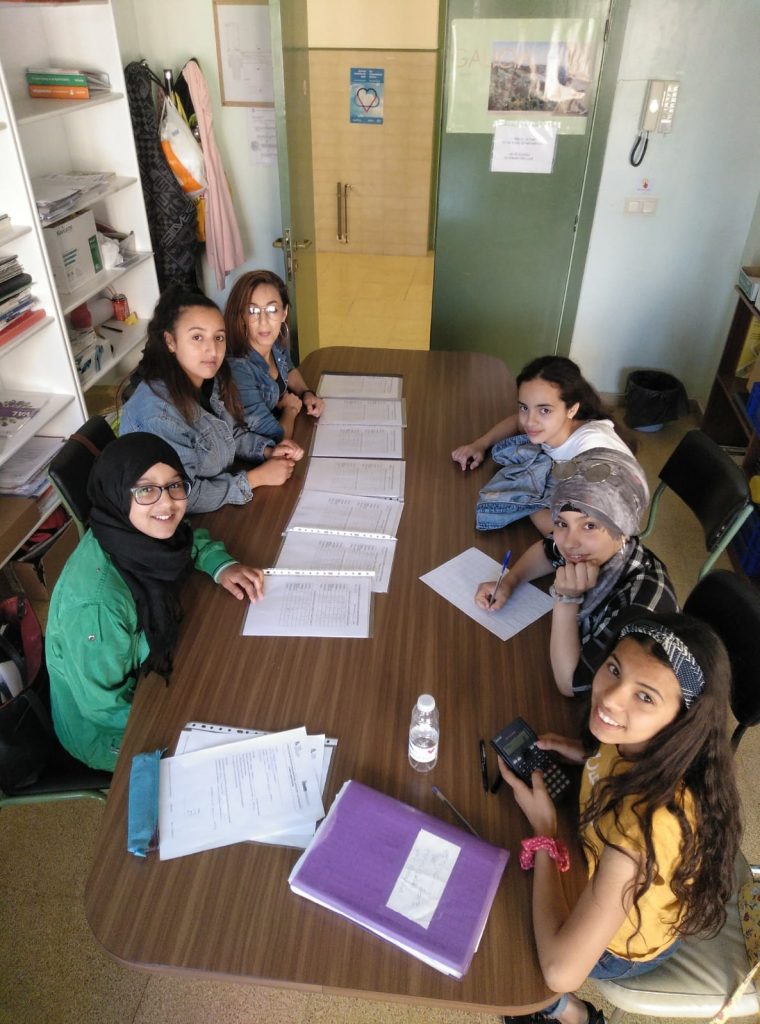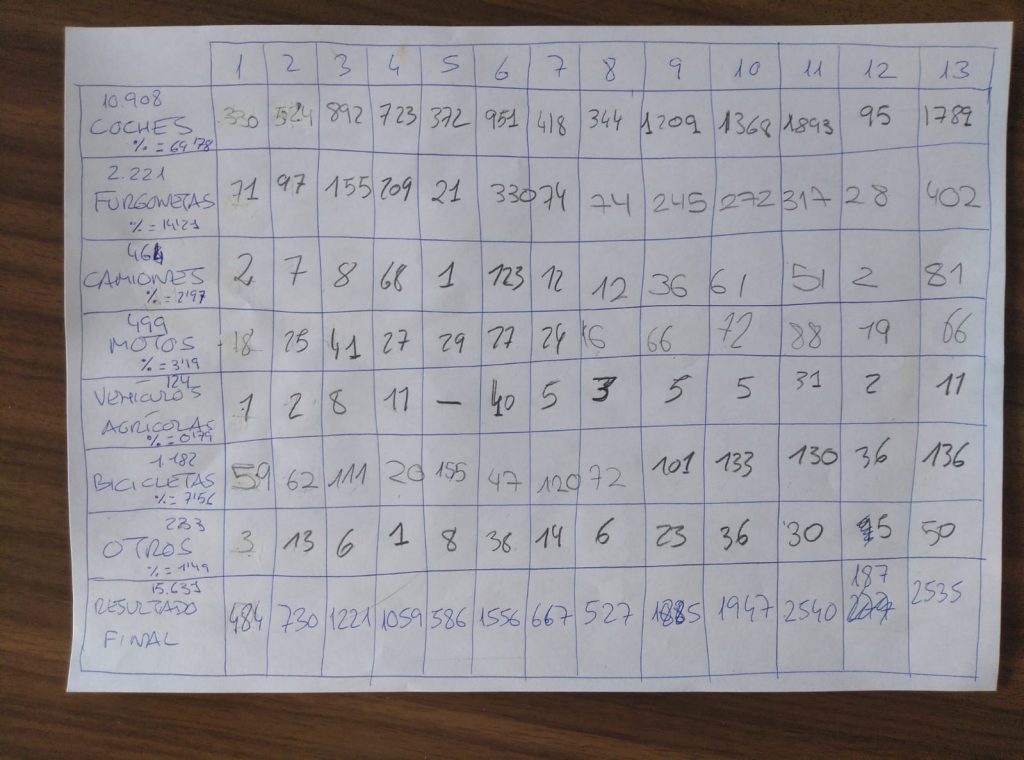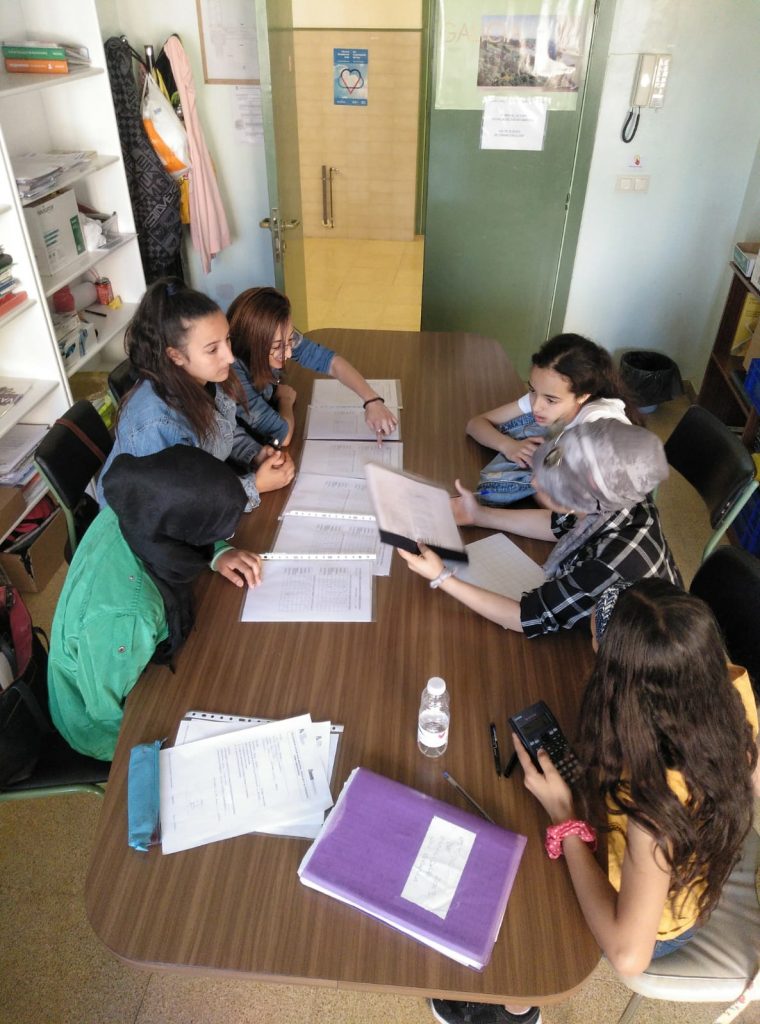
We’ve carried out a mobility study in Corella during May. The study consisted of observing the vehicles (lorries, cars, tractors, motorbikes and bicycles) and counting them for seven hours in 13 different junctions of Corella. This is the final table with all the data:

These are the final results:
-Cars: 10908 (69.78%)
-Vans: 2221 (14.21%)
-Lorries: 464 (2’97%)
-Motorbikes: 499 (3.19%)
-Agricultural vehicles: 124 (0.79%)
-Bicycles: 1182 (7.56%)
-Other vehicles: 233 (1.49%)

Thanks Asmae and Asma for your effort and good work! Well done, girls!
